Note: I have omitted and altered confidential information to comply with my NDA with KuantoKusta. All information is my own and does not necessarily reflect the views of the company.
What Is Trust Worth, in Euros?
You’ve probably been there: you found a product at a great price in a store you don’t know. No physical location, no references, no way to tell if it’s legitimate. How much more are you willing to pay for an alternative that guarantees you won’t lose your money?
It sounds like a philosophical question. It’s a business question.
At KuantoKusta, we needed to answer it with a number, and then turn that number into a label that would appear at the top of thousands of product pages.
The original request was simple: “Can we create a label that shows good deals?” Sounds easy. It quickly became a Gordian knot.
KuantoKusta was a hybrid system: part price comparison site, part marketplace. Marketplace stores sold directly through the platform and paid a commission on each sale. Other stores paid only per click we generated to their site, which let them keep prices lower, without the added commission.
The problem: Marketplace stores rarely had the lowest price. And we, while trying to increase sales within the platform, kept showing all prices, including those from cheaper stores outside it.
The label would appear in the TopBox: the top section of the product page, the spot with the most attention, the most clicks, the most conversions. On mobile especially, most users never scroll past the fold.¹
Placing the label in the right spot wasn’t the problem. The problem was: by what criteria?
The Right Question
The initial temptation was to think: “we show the best deals.” But best compared to what? Yesterday’s price? The market average? The current lowest price?
I reframed the question.
The goal wasn’t to show promotions. The goal was to help users make a good buying decision, even if the Marketplace store didn’t have the lowest price.
That changed everything.
The new question was: how much more is someone willing to pay to know their purchase will go smoothly?
It’s a legitimate question. In Portuguese e-commerce at the time, distrust of unknown stores was real. The Marketplace guaranteed the transaction: if the product didn’t arrive, the money came back.² That has value.
But how much?
The Cannonball Trajectory
If a product costs €20, paying an extra €2 for security doesn’t seem like a bad deal. That’s 10% more, but the absolute difference is small.
If the same product costs €1,000, paying an extra €100 (also 10%) doesn’t feel the same. The percentage is identical. The feeling is completely different.
This told me the tolerance threshold can’t be a fixed percentage. It has to decrease as the price goes up.
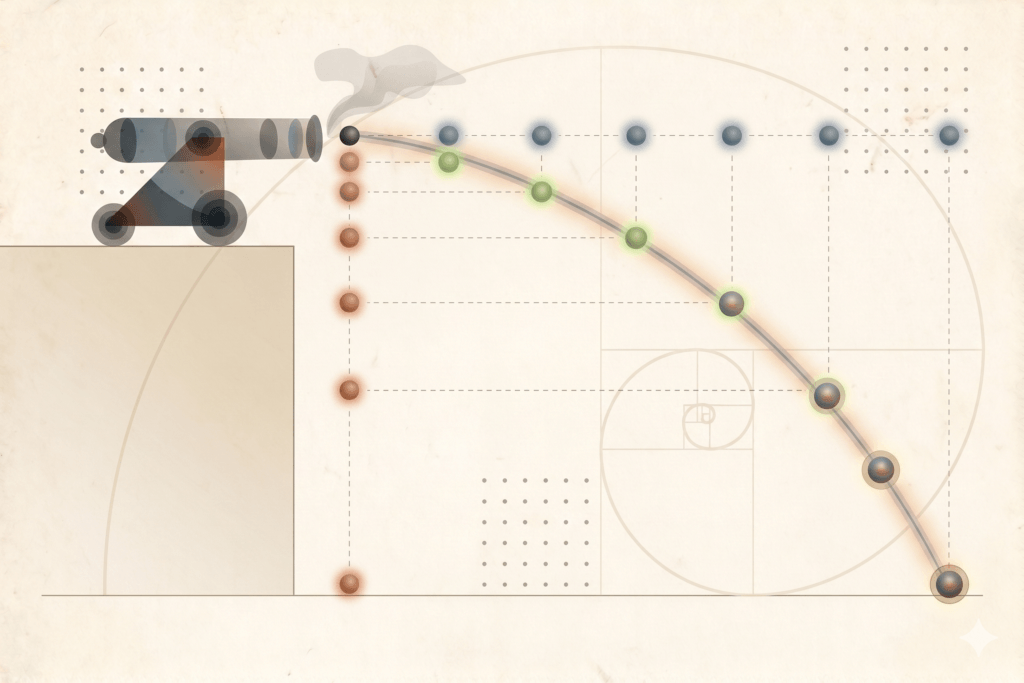
I was thinking about this when a physics image came to mind: the trajectory of a cannonball.
The moment it’s fired, it rises. Then, as gravity acts on it, the curve gradually descends. Horizontal velocity holds. Vertical momentum disappears.
That was exactly the model I needed. At low prices, the tolerance for paying more is high. At high prices, it drops. The curve isn’t linear. It’s ballistic.
I had the foundation for the first algorithm.
The Spiral Nature Already Knew
The second problem was harder.
I needed to figure out when a price was actually a good deal, not just “acceptable for buying safely,” but genuinely advantageous relative to the product’s price history.
The challenge is far from simple. Imagine: you have 20 stores selling the same product. If two of them have a significantly lower price, is the product on sale? What if half the stores have similar prices: are the other 10 overcharging, or did the first group just lower theirs recently? And if a store flags a product as being on promotion itself… we all know that’s often just a lie.
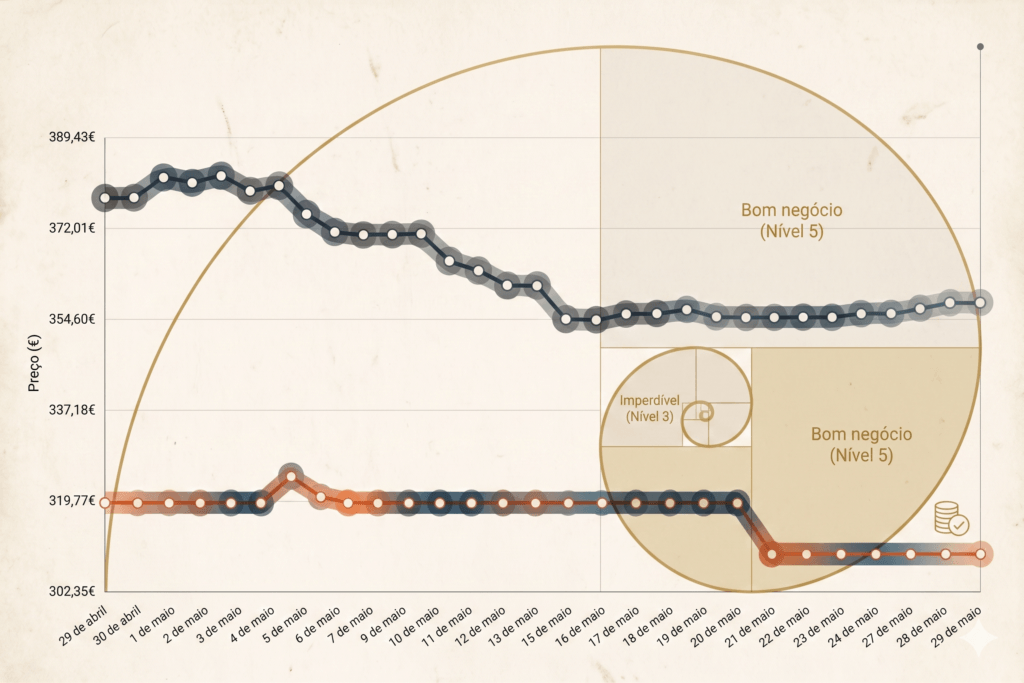
I was looking at price history charts. The orange line showed the minimum price over time. The gray one, the average across all stores. Between the two was a space where I knew, intuitively, that most people would accept paying a little more in exchange for security.
That space wasn’t fixed. It shrank with high prices, widened with low ones. There was no obvious mathematical shape to it. Until I overlaid the chart with a Fibonacci spiral.
It fit.
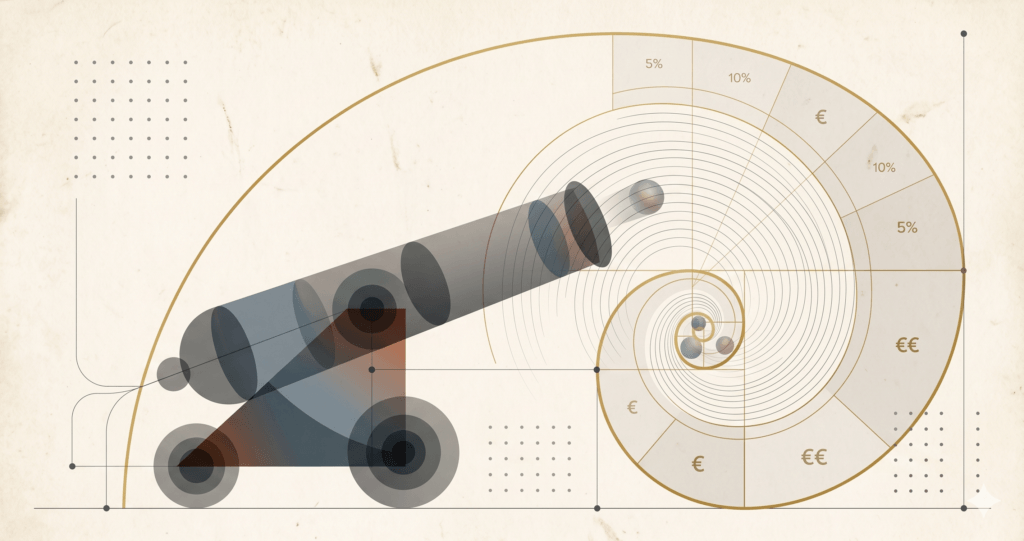
The Fibonacci sequence (1, 1, 2, 3, 5, 8, 13, 21, 34…) grows almost exponentially and has a close relationship with the golden ratio. It describes patterns in shells, flowers, and galaxies. As it turns out, it also describes human perception of price difference.
With the minimum price as zero on the spiral: a price up to level 3 was a good deal. Up to level 5, still worth it. Beyond that, the label shouldn’t appear.
This gave me two levels of classification, and therefore two labels:
– Unmissable: price clearly below the average, even if not the absolute minimum.
– Smart deal: a reasonable price, nothing extraordinary, but a sensible purchase.
The second label served a specific purpose: to give users a positive signal without inflating expectations. “It’s not the deal of the century. But you’re buying at a fair price.”
Sales Doubled
The labels went live and sales jumped over 100% immediately.
The psychological effect was real. Combined with the right iconography and color, it worked.
A month later, KuantoKusta was featured on Contas Poupança on SIC, an unsponsored fact-checking program about finding real Black Friday deals safely. What started as a promotional label became independent editorial validation of the model.
The labels kept evolving. Over time, the criteria became stricter and stopped depending on the store’s business model. What matters is the price. Not who’s behind it.
The solution wasn’t in the store or the product. It was in the question.
When I shifted from “what is the lowest price?” to “what is trust worth for this user, with this product, at this price?”, the problem transformed. And the answer was in a sequence Fibonacci formalized in the 13th century, one that nature has been using for far longer.
Sometimes design problems don’t need more data. They need the right question.
¹ “Above the fold” comes from traditional folded newspapers on newsstands: the most important stories had to be visible before the paper was opened. On screens, the fold is the line below which you need to scroll. Its position varies by screen size. The concept is largely debunked on the web, as there’s evidence users do scroll, but on mobile, attention concentrates disproportionately at the top.
² The transaction guarantee made the Marketplace more appealing because the responsibility was ours: the user wouldn’t lose money under any circumstances.